
Every engineering team agrees that observability matters. Almost none of them schedule the sprint. It loses to the feature backlog every quarter, and then an incident shows up anyway — a form that hangs, a page that takes nine seconds, a dependency that quietly started timing out — and you debug it the way people debugged software in 2009, by adding log lines and redeploying into a system that is already misbehaving.
For a Node.js service in a Docker image, zero-code OpenTelemetry auto-instrumentation means that sprint does not need to exist. It is eight lines in the Dockerfile, zero lines of application code, and you can ship it turned off. We did exactly this on zenthos.in — a React Router v7 app served by react-router-serve inside a Node 20 container, deployed as a Podman quadlet, exporting traces to a self-hosted Grafana Tempo. The change touched the Dockerfile and nothing else.
What Zero-Code OpenTelemetry Auto-Instrumentation Means
Zero-code OpenTelemetry auto-instrumentation installs one package into your container image and preloads it into the Node process with NODE_OPTIONS. The hook patches libraries as they load and emits spans for inbound and outbound calls automatically. Everything else — endpoint, service name, sampling — comes from OTEL environment variables. Your application code never changes.
The mechanism is older than OpenTelemetry and it is not magic. Node's --require flag loads a module before your entry point runs. The @opentelemetry/auto-instrumentations-node/register module uses that window to install hooks into the module loader, so when your app later asks for http, express or pg, it gets a wrapped version back. The wrapper starts a span, calls the original, ends the span, and propagates trace context through headers. By the time the first line of your server code executes, the tracer is already running.
The meta-package bundles instrumentations for most of what a Node service touches, from the core HTTP modules and Express or Fastify through Postgres, MySQL, Redis and MongoDB clients out to undici, gRPC and the AWS SDK. You never enumerate them individually unless you specifically want to.
Configuration arrives entirely through environment variables. OTEL_SERVICE_NAME names the service in your backend, OTEL_EXPORTER_OTLP_ENDPOINT points at your collector, OTEL_TRACES_SAMPLER decides how much you keep. There is no bootstrap file to write, no SDK object to construct, and — the failure mode that has burned more teams than any other — no import-ordering rule that a bundler or a well-meaning lint autofix can silently break.
The Eight-Line Dockerfile Change
Here is the entire change, verbatim from the runtime stage of our image.
01# OpenTelemetry auto-instrumentation (traces -> Tempo). --no-save keeps02# package.json/lockfile untouched; NODE_OPTIONS preloads the hook into the03# react-router-serve node process. OFF by default (OTEL_SDK_DISABLED=true) --04# the deploy config flips it on and supplies the OTLP endpoint + service name.05RUN npm install --no-save @opentelemetry/auto-instrumentations-node06ENV NODE_OPTIONS="--require @opentelemetry/auto-instrumentations-node/register" \07 OTEL_SDK_DISABLED=trueInstall with --no-save, in the runtime stage. Observability here is a property of the image, not a dependency of the application. Installing without saving leaves package.json and the lockfile untouched, which means application developers never see the package, never resolve a merge conflict over it, and never review a pull request that bumps an OpenTelemetry minor version. The platform owns the instrumentation; the app owns the app. If you later want to pin a version, you pin it in the Dockerfile, where the rest of your runtime decisions already live.
Preload with NODE_OPTIONS instead of editing an entry point. We do not start node directly — react-router-serve does. Rewriting a start command that a framework generates is a losing game. NODE_OPTIONS applies to whichever Node process the image starts, so the same two lines work for react-router-serve, next start, a bare node server.js, or whatever your framework replaces them with next year. The register entry point wires up the whole SDK from OTEL variables alone, so there is nothing else to keep in sync.
Ship it dark. OTEL_SDK_DISABLED=true is baked into the image, so what you push to the registry is fully instrumented and completely inert. Nothing is exported, no collector is contacted, and a disabled SDK costs you a rounding error at startup. That is deliberate, and it is the decision that makes the other two safe to merge on a Friday.
Flipping It On at Deploy Time
Turning tracing on is an environment change and only an environment change. In our case it lives in a Podman quadlet unit; in yours it is a compose environment block, a Kubernetes env list, or a Helm values file. The shape is the same everywhere.
01OTEL_SDK_DISABLED=false02OTEL_SERVICE_NAME=zenthos-web03OTEL_EXPORTER_OTLP_ENDPOINT=http://tempo:431804OTEL_EXPORTER_OTLP_PROTOCOL=http/protobuf05OTEL_TRACES_SAMPLER=parentbased_traceidratio06OTEL_TRACES_SAMPLER_ARG=0.25Rollback stops being a rebuild. If the collector falls over, if a bad instrumentation release starts throwing, if p99 latency moves in a direction you cannot explain, you set the disable flag back to true and restart. No image build, no registry push, no waiting on CI while an incident burns. An observability layer that can only be removed by shipping a new artifact is a second failure domain bolted onto the first.
Per-environment behaviour comes free. Staging runs unsampled, because the traffic is small and you want every trace. Production runs parentbased_traceidratio at 0.25 — a quarter of traces, with the parent's decision inherited so a distributed trace is never recorded half-way. Local development leaves the baked-in default alone and stays silent. One image everywhere, which is the entire point of building images.
That discipline is not specific to tracing. It is how we approach Kubernetes platform work generally, and the reason a choice like Karpenter versus the Cluster Autoscaler should be a configuration you can walk back rather than a migration you have to survive.
What You Actually Get Without Writing a Span
Every inbound HTTP request becomes a span tagged with route, method, status code and duration. Every outbound call the server makes becomes a child span underneath it. DNS lookups are captured too, which is more useful than it sounds the first time a resolver goes slow. Out of the box you get spans from:
httpandhttps— inbound requests plus outbound calls, with trace context propagated across service boundariesundici— the client behindfetchin modern Node, so server-side data loading is coveredexpressandfastify— route-level spans and middleware timingpg,mysql2,mongodbandioredis— query spans with statement metadatagrpcand the AWS SDK — cross-service and cloud API calls
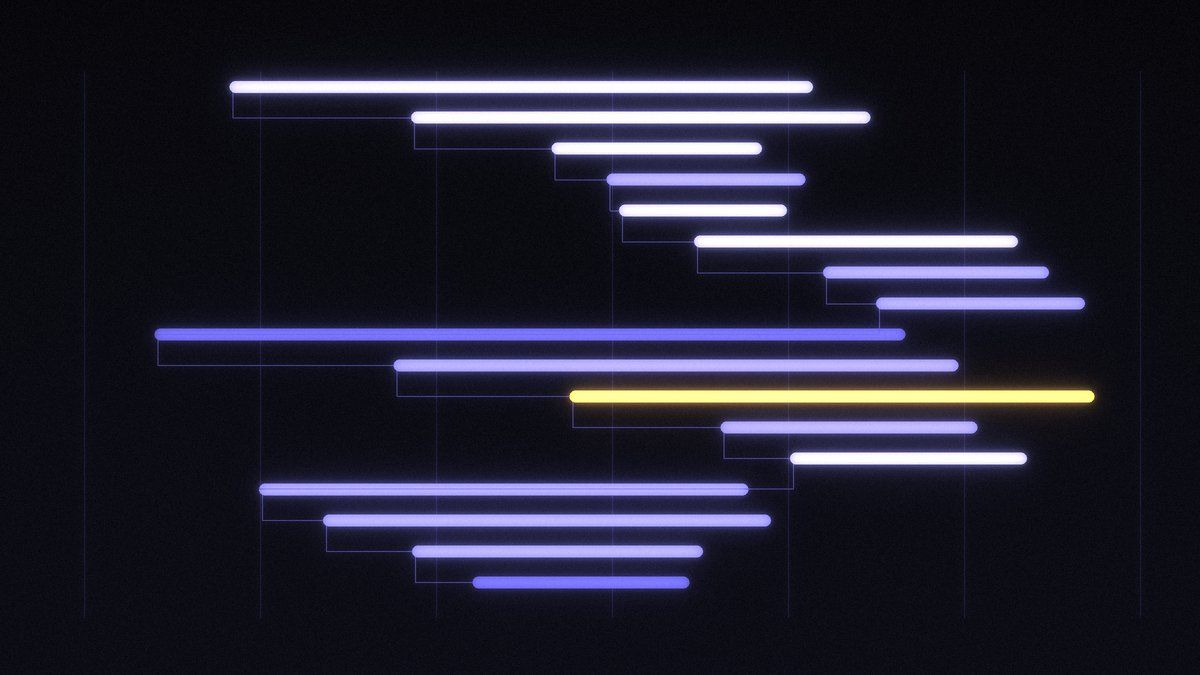
On zenthos.in that turns into a picture we simply did not have before. A page render shows our SSR loaders calling the CMS as child spans, so a slow page is immediately attributable to the backend or to us. A form submission shows the bot-check verification and the outbound email handoff as separate bars on the same timeline.
That picture changes how you handle vague bug reports. “The form hung” stops being something you answer with a guess and a code change: the waterfall shows which dependency stalled and for how long, so the fix — usually a deadline on that call — goes where the evidence points instead of where your intuition points.
Auto-Instrumentation vs Manual SDK vs eBPF
Auto-instrumentation is not the only way to get traces out of a service, and it is not the right one for every team. The honest comparison:
| Approach | Code changes | Custom business spans | Overhead | Best for |
|---|---|---|---|---|
| Auto-instrumentation (this post) | None; the change lives in the image | No | Low, and scales with span volume rather than traffic | Node.js services that need coverage this week |
| Manual SDK (NodeSDK bootstrap) | Bootstrap file plus span code in the paths you care about | Yes, with full control over attributes | Whatever you write; easy to over-instrument | Teams that need domain-level detail in their traces |
| eBPF agents (Grafana Beyla, Odigos) | None; the agent runs beside the process | No | Kernel-side, independent of the language runtime | Polyglot fleets where per-language rollout does not scale |
Read that as a sequence rather than a fork in the road. Auto-instrumentation buys you coverage in an afternoon. Manual spans get added later, in the three or four code paths where business context actually earns its keep. eBPF gets interesting once you are running six languages and cannot roll out a per-runtime change to any of them.
Overhead, Sampling, and Not Blowing Up Your Collector
The overhead question deserves a straight answer: yes, there is some. For a typical web workload — request handling, a few database queries, some outbound HTTP — auto-instrumentation costs low single-digit percent CPU. It is measurable, it is rarely what wakes you up at night, and it is dwarfed by whatever your slowest dependency is doing. Measure it on your own workload before assuming it is free or assuming it is ruinous.
The cost that actually bites is volume. Every request produces several spans, every span is bytes on the wire, and every byte lands somewhere that charges you for ingestion, storage, egress, or all three. A busy service with no sampling policy will happily generate more telemetry than application data. If you have ever worked backwards through a surprising cloud invoice — the exercise behind our writeup on why your AWS bill keeps climbing — you already know that unbounded per-request costs are how budgets die quietly.
So set a sampler on day one. OTEL_TRACES_SAMPLER=parentbased_traceidratio with OTEL_TRACES_SAMPLER_ARG=0.25 is a sane production starting point: a quarter of traces, sampled consistently, with the parent's decision honoured so distributed traces arrive whole instead of full of holes. Tune it down under load, tune it up while you are actively investigating something.
Then drop the noise. Health checks and readiness probes are the single largest source of worthless spans in any containerised service — they fire every few seconds, forever, and every one of them is identical. Trim the instrumentation set with OTEL_NODE_ENABLED_INSTRUMENTATIONS when an entire library is not worth tracing, and filter probe routes at the collector, which is a better home for policy than your application is.
Where Zero-Code Stops
Auto-instrumentation knows about libraries. It knows nothing about your business. It will tell you that a checkout request took 1.8 seconds and that 300 milliseconds of that was Postgres; it cannot tell you the cart value, the plan tier, or which of your own five internal steps was the slow one. Those spans and attributes are yours to write — and once coverage exists, adding them where they matter is cheap.
The gap is widest for LLM and agent workloads. To a generic HTTP instrumentation, a model call is a POST that took a while. What you need is the GenAI semantic conventions: model name, prompt and completion token counts, tool-call spans, retries, the shape of the agent's decision tree. None of that is visible from the transport layer, because the meaning lives inside the payload. That is why our LLMOps engagements treat instrumentation as part of the architecture rather than something bolted on afterwards, and it is the same production mindset behind our writeup on running a LangGraph Postgres checkpointer in production.
FAQ
Does OpenTelemetry auto-instrumentation slow down Node.js?
Marginally. Module patching wraps calls you were already making, so the cost tracks the number of spans you produce rather than raw traffic. For typical web services that lands in the low single-digit percent CPU range. If it worries you, sample: at a 0.25 trace ratio you pay a quarter of the export cost and still catch every recurring pattern.
Does NODE_OPTIONS --require work with ESM apps?
Yes. In current releases the register entry point installs both the CommonJS require hook and the ESM loader hooks, so an ESM application gets instrumented too. The thing to verify is coverage rather than startup: patching a pure-ESM dependency is harder than patching a CommonJS one, so confirm that the specific libraries you care about actually emit spans in your app before declaring victory.
How do I turn OpenTelemetry off in production instantly?
Set OTEL_SDK_DISABLED=true and restart the process. That is the whole procedure, and it is precisely why you bake the flag into the image with true as its default — the off switch is already wired before you ever need it. No image rebuild, no code revert, no CI queue between you and a quiet service.
Do I need a Collector, or can I send straight to the backend?
You can point the OTLP endpoint straight at your backend, and for one small service that is fine. Run a collector anyway once you have more than one. It batches and retries, so a backend hiccup does not turn into application backpressure; it gives you a single egress point to secure and monitor; it lets you filter and enrich spans without redeploying anything; and it is where tail sampling lives, keeping the traces that were slow or errored, which head sampling cannot do because it decides too early.
Instrument First, Decide Later
An uninstrumented incident is not a hard incident. It is an unexplainable one. You get a symptom, a timestamp and a pile of theories you have no way to rank. The point of the eight lines is that they take the decision off the critical path: the capability is already in the image, dormant, waiting on one environment variable that you can set at three in the morning.
So ship it this week, even if you never switch it on. The cost is a slightly larger image and a Dockerfile comment. The payoff arrives the first time someone tells you the form hung and you answer with a waterfall instead of a shrug. If you would rather have someone run the full production-readiness pass — tracing, sampling policy, collector, dashboards, and the alerts that make them worth having — that is the work our DevOps and platform engineering practice does every day, and you can start that conversation here.
Want this as a one-page checklist? Download the Node.js Zero-Code Observability Checklist (PDF) and pin it to your next deploy.